

Microsoft Excel is one of those programs that once you start you can’t stop. It is a treasure trove of great features which can speed up your workflow and processes on a daily basis. I’m often asked “Which are the top features of Excel?” and so thought it would be fitting to get this in print. When I’m training Excel (which is very often), I regularly hear myself saying “This is one of my favourite features…” so here is the definitive list.
Let’s have a look at my top 6 features of Microsoft Excel that will have you spreadsheeting like a pro!
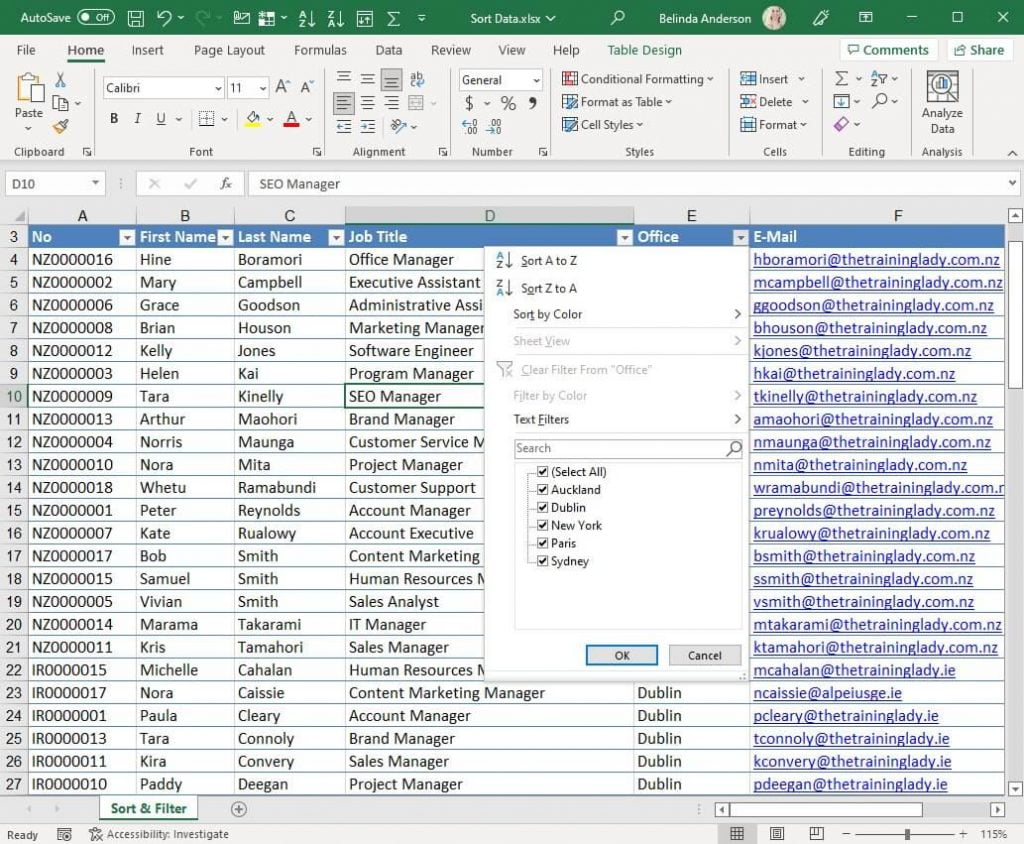
#1 Sort and Filter
Probably one of the main reasons to start using Excel is the need to sort and/or filter data. Excel allows you to sort various types of data into orders such as alphabetical, numbers in highest to lowest order or vice versa, and sort dates into chronological order.
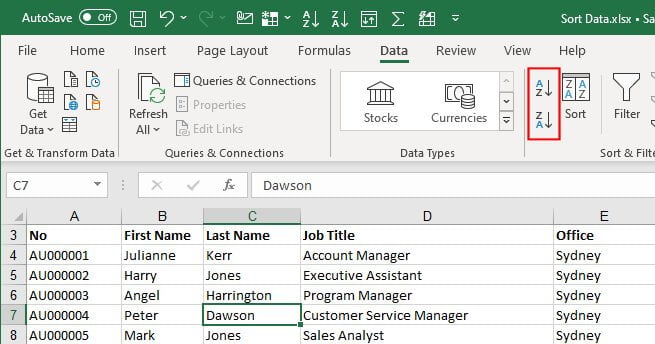
Sometimes a users’ first attempt at sorting can have some unusual outcomes and so the first thing you want to check for is that your data is ready to be sorted.
- Ensure any empty columns from your data range have been removed. Excel will use your column headings to identify where your data range starts and ends so having an empty column smack bang in the middle of your data set will cause Excel to think you actually have two sets of data and not one.
- No more highlighting! The only time you need to highlight data is when you specifically want Excel to ONLY sort that data and not the rest of the range.
We cover how to sort and filter in the following courses:
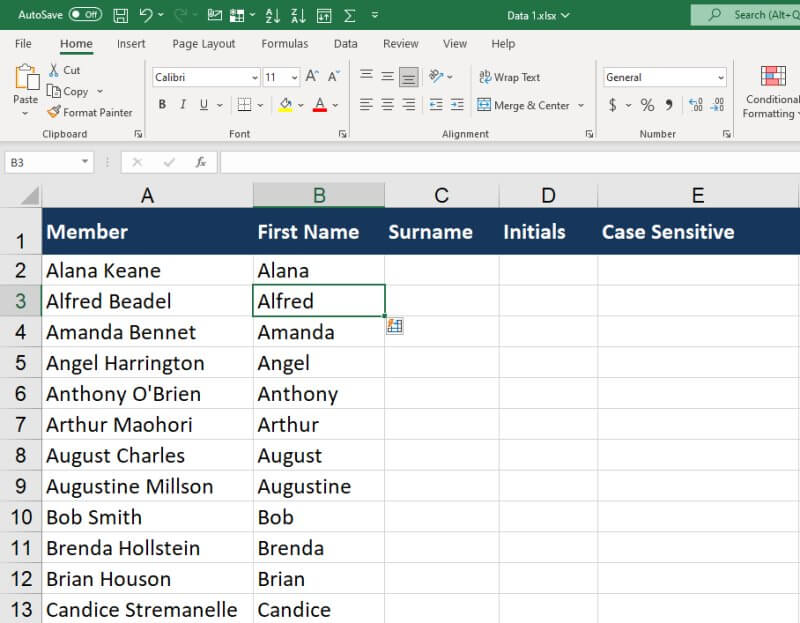
#2 Flash Fill
Flash Fill was and still is a game changer. The Flash Fill feature was released with Excel 2013 and yet I still find a lot of people do not know about this powerful feature of Excel.
Flash Fill was first touted as an “extraction” tool but in actual fact it can do much more. Flash Fill allows you to automatically replicate any pattern from your existing data.
Let’s say you have a column with detail such as client names (first and last name). You want to separate that information so that the first name is in a column and the last name in a separate column. No need to re-type the information, which is what I would have done “back in the day”. Flash Fill can do it for you. Simply give Flash Fill an example of what you are trying to do and it will replicate the pattern for you.
Find out more information on our training blog on how to use Flash Fill in Excel.
We cover how to use Flash Fill in the following courses:
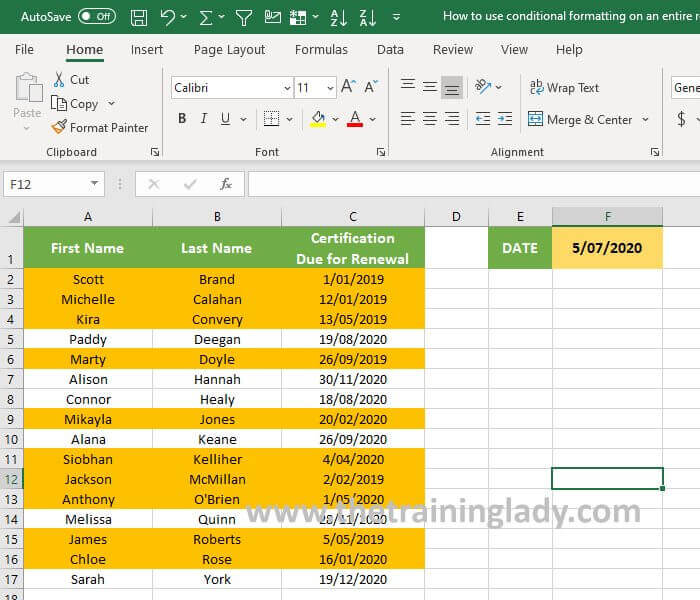
#3 Conditional Formatting
Love colour in your spreadsheets? Then you’ll love conditional formatting. As the name implies, conditional formatting allows you to specify conditions, referred to as Rules, and designate specific formats to be used when data meets those conditions.
Want all the cells with a value greater than 10,000 to go green? No problems, conditional formatting can do that.
What to know when dates have passed a specific threshold or even occur in the past? Conditional formatting can do that.
There are various built-in conditional formats to choose from including the ability to highlight cells, identify top and bottom (highest and lowest) values, include data bars within your ranges or even have fancy icon sets displayed showing you were your data is high or low.
Find out more information on our training blog on how to use Conditional Formatting in Excel.
We cover how to use Conditional Formatting in the following courses:
#4 Tables
If you are familiar with Microsoft Word then you will have used tables for layout of data. When it comes to using tables in Excel it is a different ball game.
A table in Excel automatically activates functions to make working with data easier and more efficient. By default, a table in Excel contains a header row (column headings) and easily allows you to style the range. You can also include calculated columns and a total row which is super handy.
A data set in Excel is referred to as a “range”. By converting that range into a table you automatically activate functions such as sorting and filter, header row, totals row, and calculated columns.
We cover how to use Tables in the following courses:
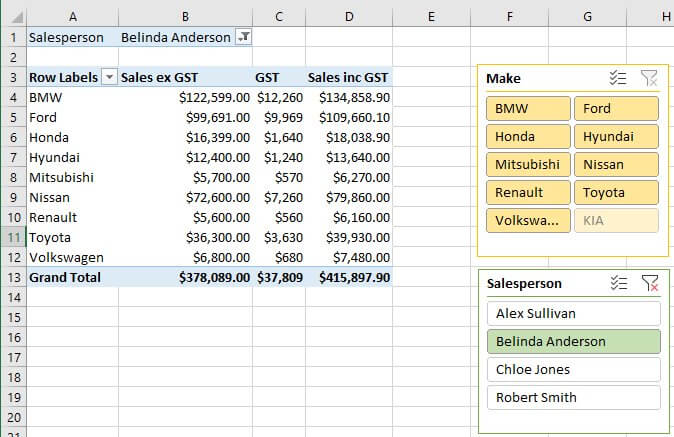
#5 Pivot Tables
Pivot Tables have the ability to scare many Excel users but once you get the idea behind how they work they can transform your data into informative and useful information.
Pivot Tables allow you to easily summarise, analyse and sort large volumes of data and display the information in a way that suits your needs.
A pivot table has several areas to work with including the ability to display data in columns or rows, perform calculations and also filter all directly within the Pivot table and without having to first create these features within the data range.
If you’d like to see how easy this process is, check out our training blog article on how to create a Pivot Table in Excel.
We cover how to use PivotTables in the following courses:
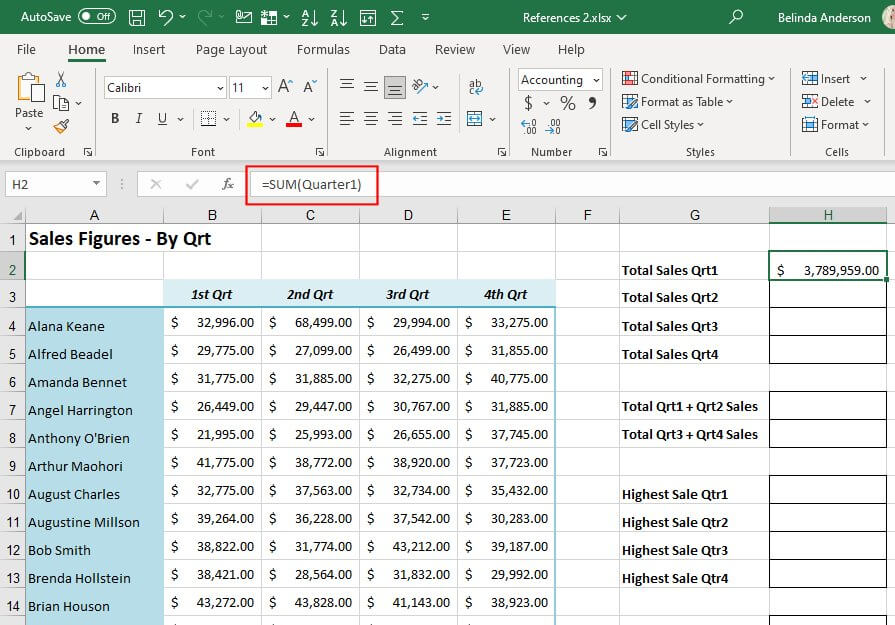
#6 Named Ranges
When working with large volumes of data you may find yourself constantly having to look up cell references, or cell names, within your data ranges. This can affect your workflow during the day.
Named ranges is the process of creating a simple text-based name for specific cells or entire cell ranges within your data. Whenever you need to reference the range in a formula you can use the text name instead.
We cover how to use Named Ranges in the following courses:
What next?
That finishes off my list of the top 6 features you should explore in Microsoft Excel. If you’d like to learn all the tips and tricks to use Microsoft Excel to it’s full potential, be sure to check out our courses available in-person or online.