
If you’ve been working with Excel for any period of time you may have heard the phrase “Pivot Table” and wondered what it is. The Pivot Table function in Excel provides a the perfect data analysis tool to allow you to quickly view and “pivot” your data into a meaningful data set.
So for those who have heard the term but aren’t quite sure exactly what a Pivot Table is or even how to create one, stay tuned and keep reading to find out some of the amazing things you can do with an Excel Pivot Table.
What is a Pivot Table?
A Pivot Table provides users with a way to analyse, summarise, sort, group and calculate data. As the name implies, you can “pivot” data easily to provide a different result or different perspective of the results.
Pivot Tables are perfect for analysing large quantities of data. Lets say you have 15,000 records in your data set and you have specific questions you need to answer from that data. You could use features such as filters, sorting, maybe conditional formatting, and add some formulas to try to find the answers. Or you could utilise the Pivot Table feature to extract that information in a fraction of the time.
Features of a Pivot Table
Not only can you easily pivot your data to look at data from different angles, you can also utilise lots of features within the pivot table to extend the functionality.
Functions
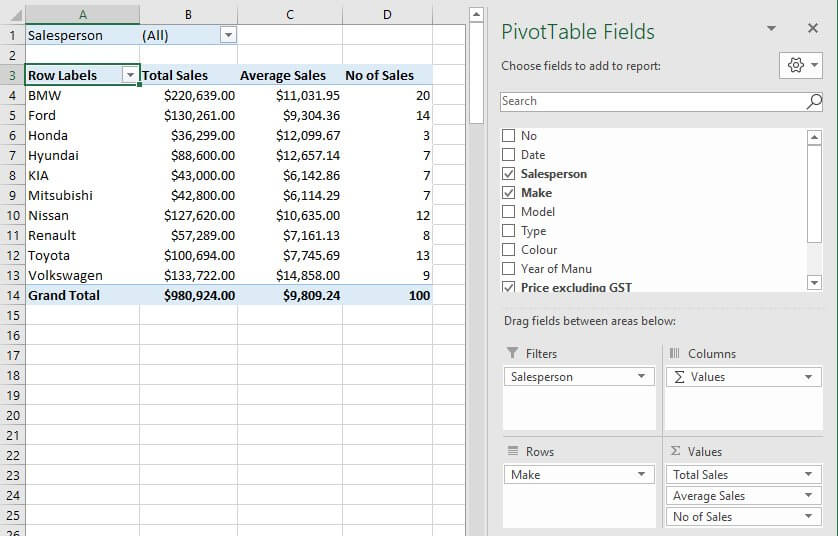
A Pivot Table in Excel will easily let you add functions we are very used to seeing in Excel. Functions including Sum, Count, Average, Min, Max and StdDev can be chosen from the list of calculations available. You don’t even need to type the formula in, the pivot table adds it in automatically.
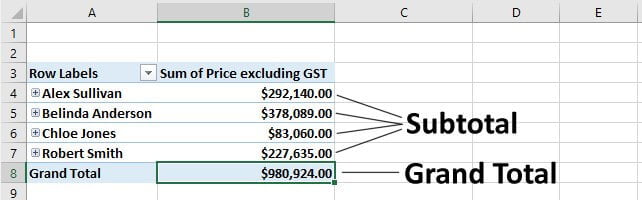
Subtotals and Grand Totals
Quickly add subtotals and grand totals to your data set without needing these to be in your original data set. You don’t even need to add a formulas to create these. You can even adjust these to suit using simple options in the Excel Ribbon.
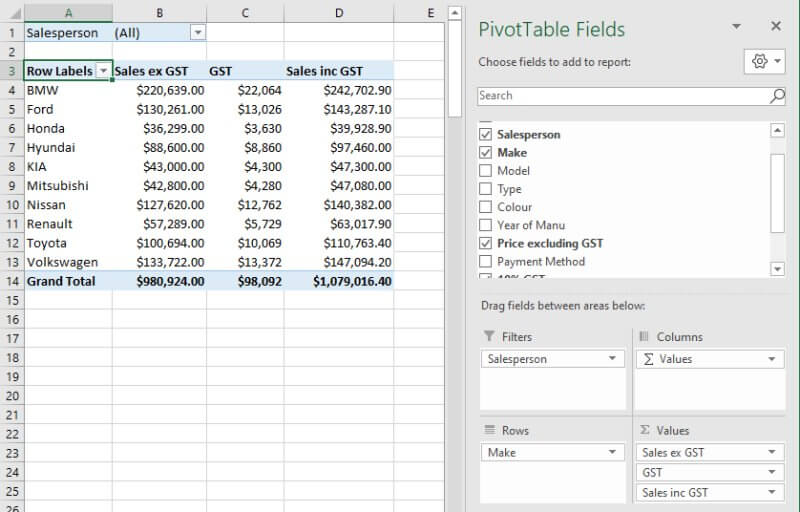
Calculated Fields
Need to add calculations into your data which aren’t in your original data set? No problems, create a calculated field within your pivot table. You can even format the calculated field as currency, number, percentage just as you can with standard data in Excel.
In my example below, the original data set only have the pricing exclusive of GST. I really need to have the GST value and total sales including GST included. So I created two x calculated fields to work this out for me within the pivot table.
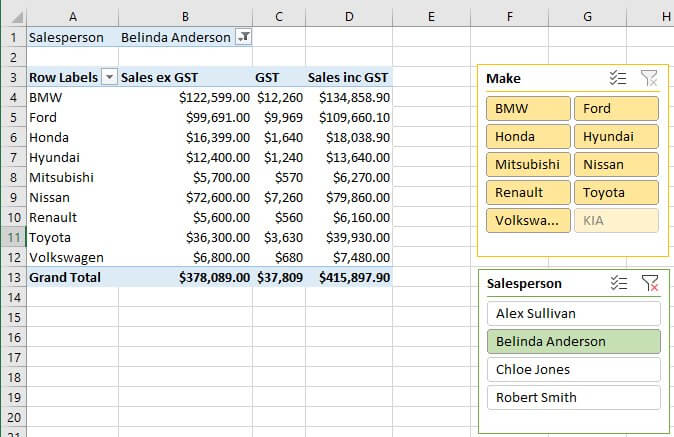
Slicers
Slicers are quite possibly one of my favourite features of Excel tables and Pivot Tables.
Slicers are a fancy way of filtering your data using a simple button interface. The great thing about slicers is the fact that users who are not comfortable with Excel can use them with the click of the mouse.
Group Data
The grouping options in a Pivot Table are amazing. Let’s say you want to manually group some records together, no problems, you can group them manually within the Pivot Table.
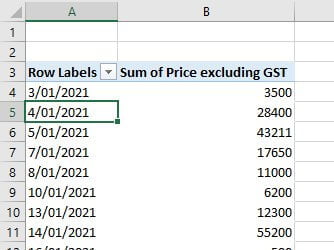
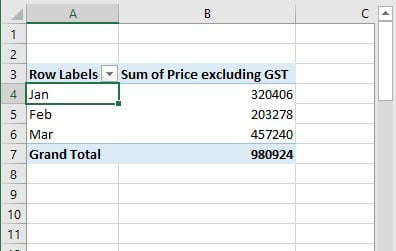
Maybe you have a list of dates and you are intersted in grouping them by month or even year. No problems you can do that within the Pivot Table.
Maybe you have some number values that you’d like to group into specific ranges. No problems you can do that within the Pivot Table.
From this..
To this..
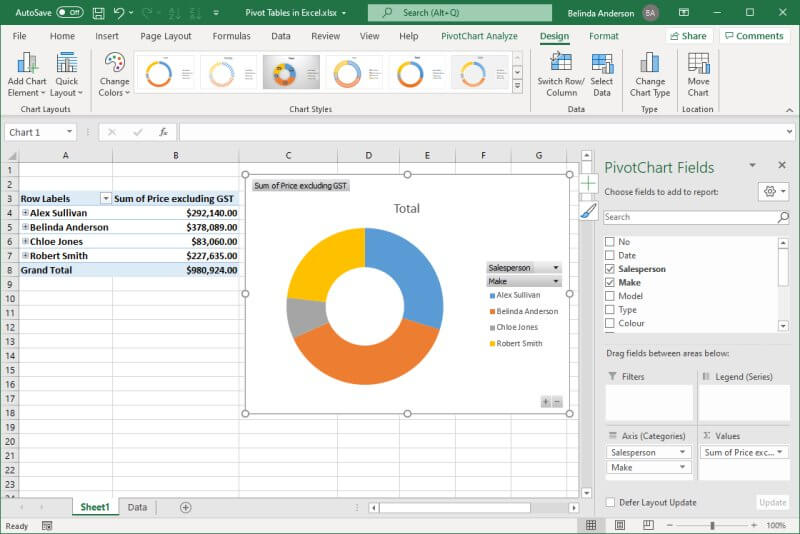
Pivot Charts
Once you have set up your pivot table you can then represent the data using a pivot chart. The pivot chart options provides you with the same pivot features of a pivot table however the data is displayed in a chart rather than a table layout.
How to create a Pivot Table
The process of creating a pivot table is actually quite straight forward. I tend to find that users have seen pivot tables before which are quite complex and look more difficult to create than they actually are so it scares users away from exploring their functionality.
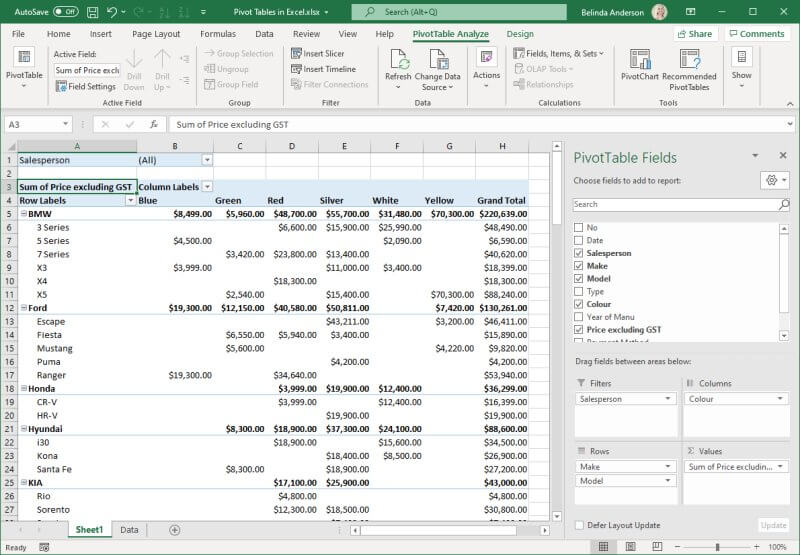
A pivot table is made up of a few key areas.
- The Pivot Table Report Area
- Fields
- Areas (Filters, Rows, Columns, Values)
Learning how to create a basic pivot table is the starting point to expanding your knowledge and understanding of what you can do within the pivot table to extend the data and extract the information you need.
To learn how to create a pivot table in Excel, check out my training blog. >>>>>>>>
Want to learn more?
If you are interested in upskilling yourself or your team to utilise the powerful functionality of Pivot Tables in Excel, or any Microsoft 365 product, be sure to check out our online or face to face course options.
Not sure which options would be suit your team? Contact us to discuss your needs and begin the process to undertake our free skills analysis.